Just posted: How Many Sessions Before a Backtest Means Anything

Backtest Bench

ORB Trading Backtest

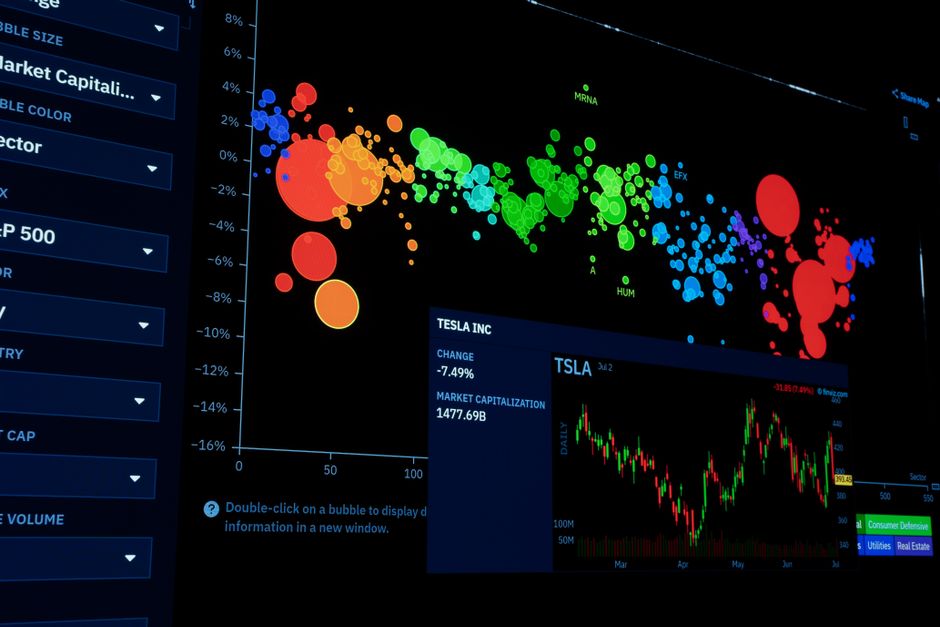
Colorful data visualization of stock market trends with financial charts.

What We Cover

A Backtest Is an Argument, Not a Result

A backtest produces a number and the number feels like evidence. It is closer to an argument, and like any argument it depends entirely on the assumptions underneath it. Change the fill model, the instrument list, or the period tested and the same rule set produces a different conclusion. None of that makes backtesting useless. It makes the output conditional, and the conditions are the part worth examining first, because they are the part that quietly decides whether the result means anything at all.

Sample Size Decides What You Are Allowed to Conclude

An opening range strategy takes at most one trade per session, so a year of data is a few hundred observations rather than a few hundred thousand. That is a small sample by any standard, and small samples produce wide bands of plausible outcomes around whatever average you measured. The uncomfortable implication is that a run of good sessions and a genuinely good rule look identical at that scale. Knowing roughly how many sessions are needed before a difference separates from noise changes how confidently you read an equity curve.

The Instrument List Was Chosen After the Fact

Most tests run on a handful of instruments picked because they are liquid, familiar and currently active. That selection happened after the period being tested, using knowledge nobody had at the start of it. Contracts that were delisted, pairs that stopped moving, and names that lost their liquidity are absent, and their absence flatters the result. The list is not neutral background. It is a decision made with hindsight, and it belongs in the write up next to the rules themselves.

Fills Are Where the Optimism Hides

A stop assumed to fill at its price, an entry assumed to fill at the level rather than beyond it, and bars assumed to contain no ambiguity are three separate pieces of generosity. Each is small. Together they can account for the whole edge of a strategy that trades often and holds briefly. The correction is not to guess a slippage number and feel finished. It is to test how sensitive the result is to that number, which shows whether the edge survives being pessimistic.

Testing Methods Covered Here

The articles here stay on method rather than on rules. How many sessions a conclusion needs before it earns confidence, what the instrument list quietly assumes, where fill optimism enters, and what walking a test forward through unseen data does that reoptimising cannot. Nothing here proposes a specific parameter set, because a parameter set that was not tested honestly is worth less than no test at all. The subject is the machinery that produces the number, not the number.

Latest Guides

How Many Sessions Before a Backtest Means Anything

Close-up view of financial analysis on laptop and screen with calculator for business strategy.

Count trades, not years. A test spanning half a decade of an opening range rule sounds substantial until you notice how few decisions it actually contains. A strategy taking one trade per session gathers roughly as many observations in a year as a fast intraday system gathers in a fortnight. The span is impressive. The sample is thin, and the sample is what decides how much the result is entitled to claim.

The Arithmetic of One Trade a Day

Close-up of a desk with financial graphs, a calculator, and a fist symbolizing determination.

There are around two hundred and fifty sessions in a trading year, and a rule that trades every one of them collects that many observations. Almost no rule does. Add a filter for range width, a filter for direction, a requirement that the break happen before a certain time, and the count falls, sometimes by a third or more. Five years of history can reduce to a few hundred real trades once the filters have done their work.

That is a number small enough to be dominated by a handful of unusually good or unusually bad sessions. Remove the best few trades from a small sample and look at what remains. If the result changes character, the sample was carrying the conclusion on a few shoulders rather than on its own weight.

How Wide the Uncertainty Actually Is
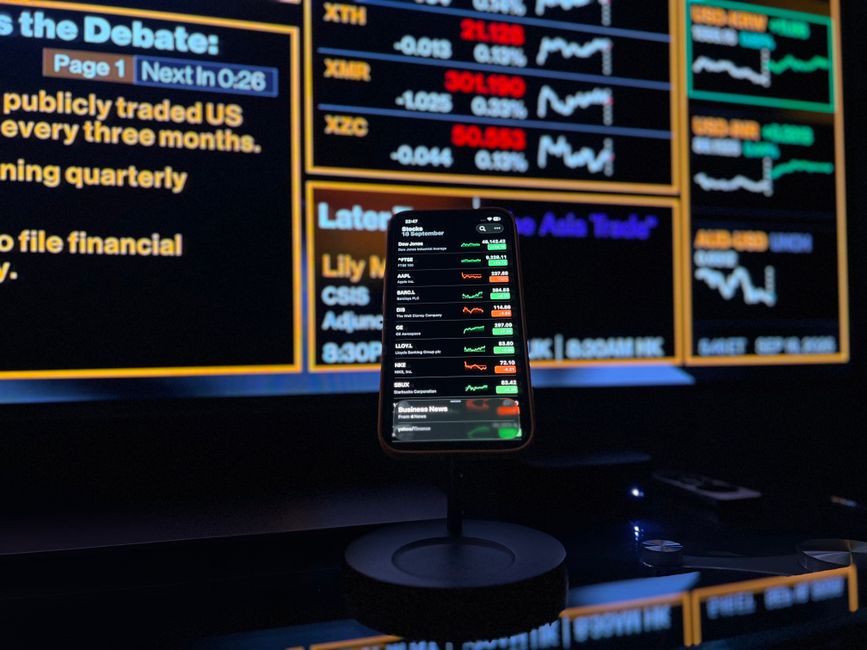
Smartphone displaying stock market data against financial screen backdrop in London.

Every measured average sits inside a band of plausible true values, and the band narrows slowly. It narrows with the square root of the sample, which means quadrupling the number of trades halves the uncertainty rather than quartering it. Going from a few hundred trades to a few thousand is years of additional history for a modest improvement in confidence.

The practical consequence is uncomfortable. At the sample sizes an opening range rule realistically produces, a genuinely profitable rule and a break even rule that got lucky can produce equity curves that look alike. Nothing in the curve distinguishes them. Only the width of the band does, and the band is rarely drawn.

Every Split Costs You Twice

The instinct when a result looks good is to check whether it holds up in subsets. Does it work in the first half and the second half? On up days and down days? On each instrument separately? Each of these questions is reasonable and each one divides an already small sample.

A test with a few hundred trades split four ways leaves subsets too small to say anything about. Worse, if you run enough splits, one of them will look poor and one will look excellent through chance alone, and the temptation is then to build a filter around the excellent one. That filter is fitted to noise, and it will be the first thing to fail forward.

Not All Sessions Are Independent

Sample size assumes observations are independent, and consecutive sessions are not. A volatile stretch produces several wide range days in a row, all of which behave similarly. A quiet month produces a run of compressed ranges that also behave similarly. The effective sample is smaller than the trade count suggests, because clusters of correlated sessions carry roughly the information of a single session each.

Testing across several instruments does not solve this either, if those instruments move together. Two index products on the same session are close to one observation, not two. A test that counts them as two is quietly overstating how much evidence it has.

Working With a Short Sample

None of this means a short test is worthless. It means the conclusions drawn from it should be coarse. A short sample can tell you that a rule is catastrophic, because catastrophic shows up quickly. It can tell you that the rule is executable and that the data supports the mechanics. What it cannot do is separate a small edge from no edge, and that is usually the exact question being asked of it.

The honest posture is to state the trade count alongside every result and to treat the count as part of the finding rather than a footnote. A rule with a modest average over a few hundred trades is a hypothesis. It becomes something firmer only as sessions accumulate, and there is no way to accelerate that.

The Fill Assumption That Makes Every Backtest Look Better

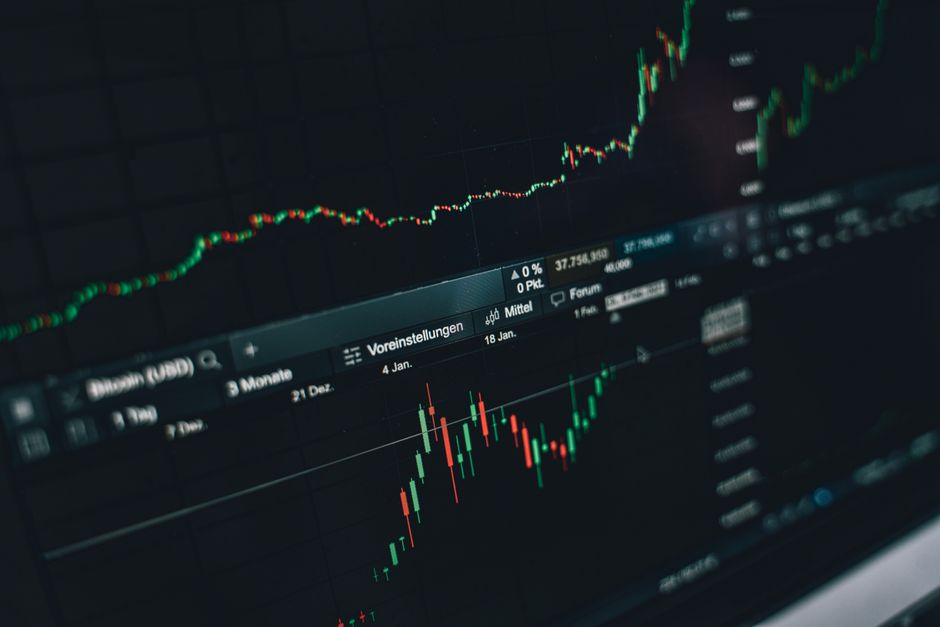
Close-up of a digital market analysis display showing Bitcoin and cryptocurrency price trends.

Backtests do not usually fail because the rules were wrong. They fail because the rules were evaluated against a market that filled every order politely at the price on the screen. Real execution is worse than that in several small ways at once, and for a strategy that trades often and holds briefly, several small ways can amount to the entire result.

The Prices a Test Quietly Grants You

Hands typing on a laptop displaying stock market charts and a smartphone with financial apps.

A typical backtest assumes an entry executes at the range boundary the instant price touches it. In practice a stop order placed at that boundary becomes a market order when it triggers, and market orders fill at whatever is available. At the moment a range breaks, what is available is usually worse than the boundary, because a great many other breakout orders triggered at the same instant. The test grants a price that the mechanism of the trade makes unlikely.

The same generosity applies to the exit. A limit order sitting at a target fills only if price trades through it and the queue ahead of you clears. A test that marks the trade a winner because price touched the target is assuming a fill that may not have happened at all.

Stops Are Where It Costs Most

Close-up of digital cryptocurrency market graph showing price fluctuations and trading data.

A stop is the order most likely to be filled away from its price, and it is filled away in the direction that hurts. Stops cluster at obvious levels, and the opposite edge of the opening range is about as obvious as levels get. When it goes, it often goes quickly, through a thinner book, with other stops triggering alongside.

A test that assumes clean stop fills is therefore understating the cost of exactly the trades that were already the bad ones. It shrinks the left tail of the distribution, which is the part of the distribution that determines whether the strategy survives at all.

The Path Inside the Bar

Most tests run on bar data, and a bar records four prices while hiding the order in which they occurred. When both the stop and the target sit inside the range of a single bar, the engine has to guess which came first. Some assume the favourable one, some assume the unfavourable one, and many do not document the choice at all.

For an opening range rule this matters more than it does for a slower strategy, because the stop and the target are often close enough together to land inside the same bar during the volatile stretch after the break. If the engine resolves those ambiguous bars in your favour, the result is not a measurement. It is an assumption dressed as one.

Sensitivity Beats a Single Number

The common response is to add a fixed slippage cost and consider the problem handled. That converts one unexamined assumption into another, since the chosen figure is itself a guess. The more useful exercise is to run the test at several cost levels and watch what happens to the result.

What you are looking for is the point where the edge disappears. If the strategy survives costs well above anything you would realistically pay, the fill assumption is not what the result depends on. If it collapses somewhere just above a plausible figure, then the reported edge is a statement about the execution model rather than about the market, and no amount of additional history will change that.

Where the Problem Bites Hardest

Thin instruments, wide spreads and small ranges each amplify the effect, and they often arrive together. A compressed range on a quiet product produces a target only a few ticks away, which means execution cost is a large fraction of the whole trade. The same rule on a liquid product with a wide range may barely notice.

This is why a portfolio result can hide the problem. Aggregated across instruments, the ones where fills are cheap subsidise the ones where they are not, and the summary line looks acceptable while several components are unprofitable in practice. Breaking the result out per instrument, with realistic costs applied to each, tends to be less flattering and considerably more useful.

Walking a Test Forward Instead of Optimizing It

Close-up of a digital market analysis display showing Bitcoin and cryptocurrency price trends.

Take a rule with three adjustable numbers, try a few dozen values for each, and something will come out looking excellent. That is not a discovery, it is an inevitability. With enough combinations, the best one is the one that fitted the historical noise most closely, and noise does not repeat. Walking a test forward is the least elaborate answer to that problem, and it is uncomfortable in a way that reoptimising never is.

What a Search Over Parameters Really Finds

Hands typing on a laptop displaying stock market charts and a smartphone with financial apps.

An optimiser reports the combination with the best score, and reports it with no indication of how much better it was than the alternatives. That gap is the interesting part. If the best setting sits on a broad plateau where neighbouring values perform similarly, the result probably reflects something structural. If it sits on a spike surrounded by mediocrity, the setting is describing particular sessions rather than a persistent behaviour.

The spike is the more common outcome, and it is also the one that looks best on a report. Nothing in the output labels it as fragile. You have to go and look at the surrounding values to see it, and by then the number has usually been written down.

The Shape of the Procedure

Close-up of digital cryptocurrency market graph showing price fluctuations and trading data.

A walk forward splits the history into consecutive blocks. Parameters are chosen on the first block, then applied unchanged to the block that follows, which the optimiser never saw. The window then slides forward, parameters are rechosen on the newly available data, and the process repeats to the end of the history.

The result you keep is the concatenation of the untouched blocks. It is not the best the strategy could have done. It is what the strategy would have produced if you had been choosing parameters as the data arrived, which is the only situation you will ever actually be in.

Reading What Comes Out

Two things are worth watching. The first is the gap between in sample and out of sample performance in each block. A large and consistent gap says the fitting procedure is picking up noise, regardless of how good the final number looks. A small gap says the parameters are catching something more durable.

The second is whether the chosen parameters stay in the same neighbourhood block to block. Values that drift gently are plausible. Values that jump to a different corner of the search space each time are being redrawn from scratch, which means there was nothing stable to find and the optimiser was simply describing whichever block it was handed.

What It Costs

Walking a test forward consumes history. Each block spent choosing parameters is a block that cannot also serve as evidence, so an already small sample gets smaller. For an opening range rule with a few hundred trades to begin with, this is a real constraint rather than a theoretical one. Blocks large enough to fit on leave few blocks to test on, and blocks small enough to leave many test segments are too small to fit anything reliably.

There is no clean resolution. The usual compromise is to reduce the number of parameters being fitted until the procedure becomes affordable, which is a healthier response than it sounds. A rule with one adjustable number needs far less data to fit than a rule with four, and it is far harder to overfit by accident.

It Is Not a Guarantee

A walk forward run once is honest. A walk forward run twenty times, with the rule structure adjusted between runs until the out of sample segments look good, is optimisation again with extra steps. The unseen data stops being unseen the moment its results are used to change the design.

The only defence is to decide what the rule is before running the procedure, and to accept the answer that comes back, including when the answer is that the rule does not work. That discipline is the whole value of the method, and it is also the part most often skipped, because a disappointing walk forward always looks like it could be fixed with one more adjustment.

Back to top