The Fill Assumption That Makes Every Backtest Look Better
09/03/2026
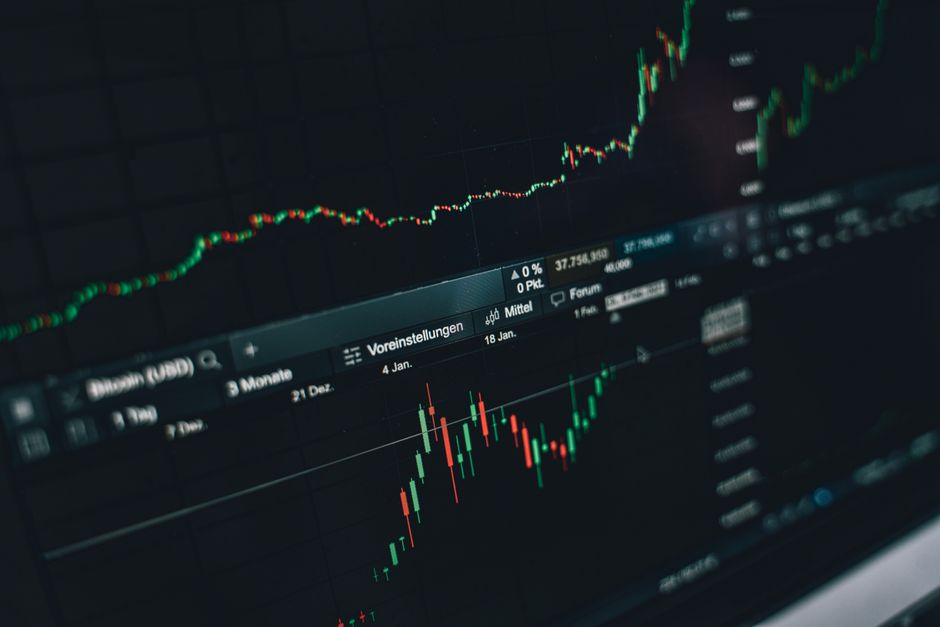
Backtests do not usually fail because the rules were wrong. They fail because the rules were evaluated against a market that filled every order politely at the price on the screen. Real execution is worse than that in several small ways at once, and for a strategy that trades often and holds briefly, several small ways can amount to the entire result.
The Prices a Test Quietly Grants You

A typical backtest assumes an entry executes at the range boundary the instant price touches it. In practice a stop order placed at that boundary becomes a market order when it triggers, and market orders fill at whatever is available. At the moment a range breaks, what is available is usually worse than the boundary, because a great many other breakout orders triggered at the same instant. The test grants a price that the mechanism of the trade makes unlikely.
The same generosity applies to the exit. A limit order sitting at a target fills only if price trades through it and the queue ahead of you clears. A test that marks the trade a winner because price touched the target is assuming a fill that may not have happened at all.
Stops Are Where It Costs Most
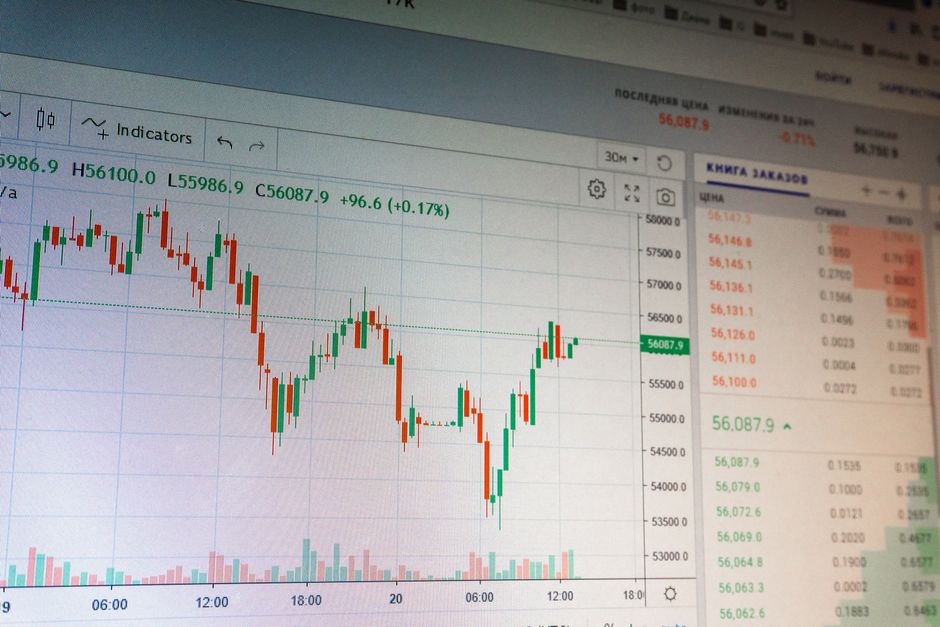
A stop is the order most likely to be filled away from its price, and it is filled away in the direction that hurts. Stops cluster at obvious levels, and the opposite edge of the opening range is about as obvious as levels get. When it goes, it often goes quickly, through a thinner book, with other stops triggering alongside.
A test that assumes clean stop fills is therefore understating the cost of exactly the trades that were already the bad ones. It shrinks the left tail of the distribution, which is the part of the distribution that determines whether the strategy survives at all.
The Path Inside the Bar
Most tests run on bar data, and a bar records four prices while hiding the order in which they occurred. When both the stop and the target sit inside the range of a single bar, the engine has to guess which came first. Some assume the favourable one, some assume the unfavourable one, and many do not document the choice at all.
For an opening range rule this matters more than it does for a slower strategy, because the stop and the target are often close enough together to land inside the same bar during the volatile stretch after the break. If the engine resolves those ambiguous bars in your favour, the result is not a measurement. It is an assumption dressed as one.
Sensitivity Beats a Single Number
The common response is to add a fixed slippage cost and consider the problem handled. That converts one unexamined assumption into another, since the chosen figure is itself a guess. The more useful exercise is to run the test at several cost levels and watch what happens to the result.
What you are looking for is the point where the edge disappears. If the strategy survives costs well above anything you would realistically pay, the fill assumption is not what the result depends on. If it collapses somewhere just above a plausible figure, then the reported edge is a statement about the execution model rather than about the market, and no amount of additional history will change that.
Where the Problem Bites Hardest
Thin instruments, wide spreads and small ranges each amplify the effect, and they often arrive together. A compressed range on a quiet product produces a target only a few ticks away, which means execution cost is a large fraction of the whole trade. The same rule on a liquid product with a wide range may barely notice.
This is why a portfolio result can hide the problem. Aggregated across instruments, the ones where fills are cheap subsidise the ones where they are not, and the summary line looks acceptable while several components are unprofitable in practice. Breaking the result out per instrument, with realistic costs applied to each, tends to be less flattering and considerably more useful.